Running deep health checks on legacy endpoints
In D1 2.0, it is still possible to use endpoints from older versions (even though they are not exposed in Swagger). To make sure these endpoints are operational after installation, you can run a legacy deep health check, as explained in this document.
You will need a sessionId and an accessId to run the deep health check on a specific repository. To run it on all repositories, you will only need the sessionId.
To get the sessionId
To get the sessionId, follow the below procedure:
Log in to D1. Change the URL to
https://your_hostname:port/services/home.Select ADx Auth Web Terminal under Web Terminals:

The Authentication servlet opens.
Click show to show the username and password fields (if not shown already).
Enter your username and password, then click Execute. Wait until you see the Action was executed message.
Still on the same page, open the console of your web browser (F12 in most browsers). The
sessionIdshould be displayed: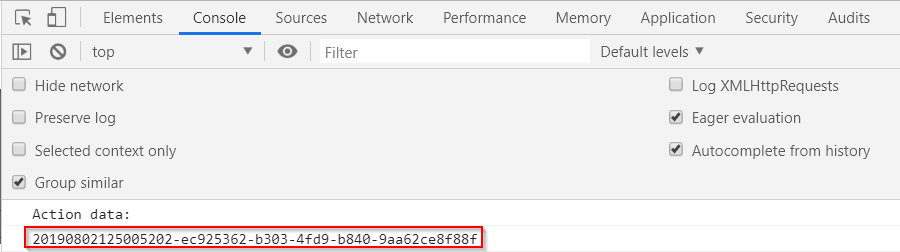
Use this
sessionIdfor deep health check.
To get the accessId
To get the accessId, follow the below procedure:
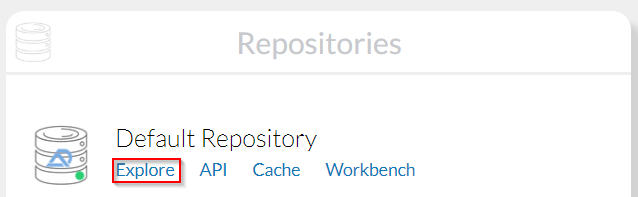
Log in to D1. Change the URL to
https://your_hostname:port/services/home.From the landing page, select Explore under the access where you're running the health check:

Copy the
accessIdfrom the URL:
To run the deep health check
To run the deep health check on legacy endpoints, follow the below procedure (skip steps 1 and 2 if you already have a folder without a parent in the repository you're checking):
Log in to D1. Change the URL to
https://your_hostname:port/services/home.From the landing page, select Explore under the repository where you're running the health check:
Select My Folders from the menu on the left. Use the + button to create a new folder without a parent.

At least one folder without a parent must exist for the health check to work.
Go back to the landing page and select ADx DeepHealthCheck Web Terminal under Web Terminals:

Show the health check type you need (all repositories or a specific repository).
When prompted, provide the
sessionIdandaccessId(for a specific repository).Click Execute. Wait until you see the Action was executed message.
Still on the same page, open the console of your web browser (F12 in most browsers). You should see a response:
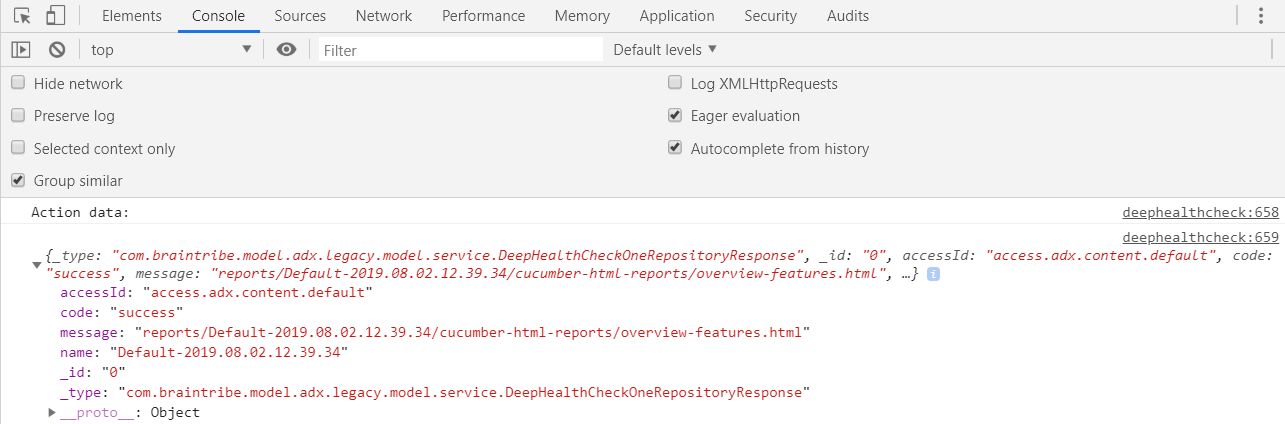
This report is saved on the D1 host machine, under
your_installation_directory/runtime/host/webapps.Copy the
messageof the response, starting with/reports.Paste the message after your host and port in the URL, as in
http://localhost:9080/reports/Default-2019.08.02.14.32.40/cucumber-html-reports/overview-features.html. The report opens in the browser:
Make sure that all reported features have the status
Passed. If so, you can use the legacy endpoints on the checked repository. Otherwise, contact your support person to solve any issues.
To list all reports
Click show next to the
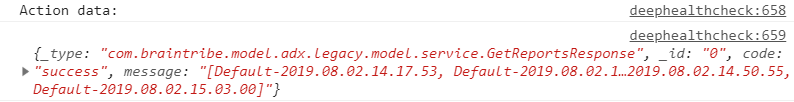
List all reportssection.Enter the
sessionIdand click Execute.Still on the same page, open the console of your web browser (F12 in most browsers). You should see a response listing all reports generated this session:
To delete a report
- Click show next to the
Delete reportsection. - Enter the
sessionIdand the report name you want to delete. click Execute. - Still on the same page, open the console of your web browser (F12 in most browsers). You should see a response confirming that the report has been deleted:
